Disaster Recovery
2020 Cares Act
Woolpert and Centric Consulting are working together to help local governments access, maximize and expedite funding from the Coronavirus Aid, Relief and Economic Security (CARES) Act. The longtime partners will provide CARES Act advisory and implementation services to enable municipalities to track, process, utilize and benefit from resources related to COVID-19. Click here for more information on this time-sensitive program.
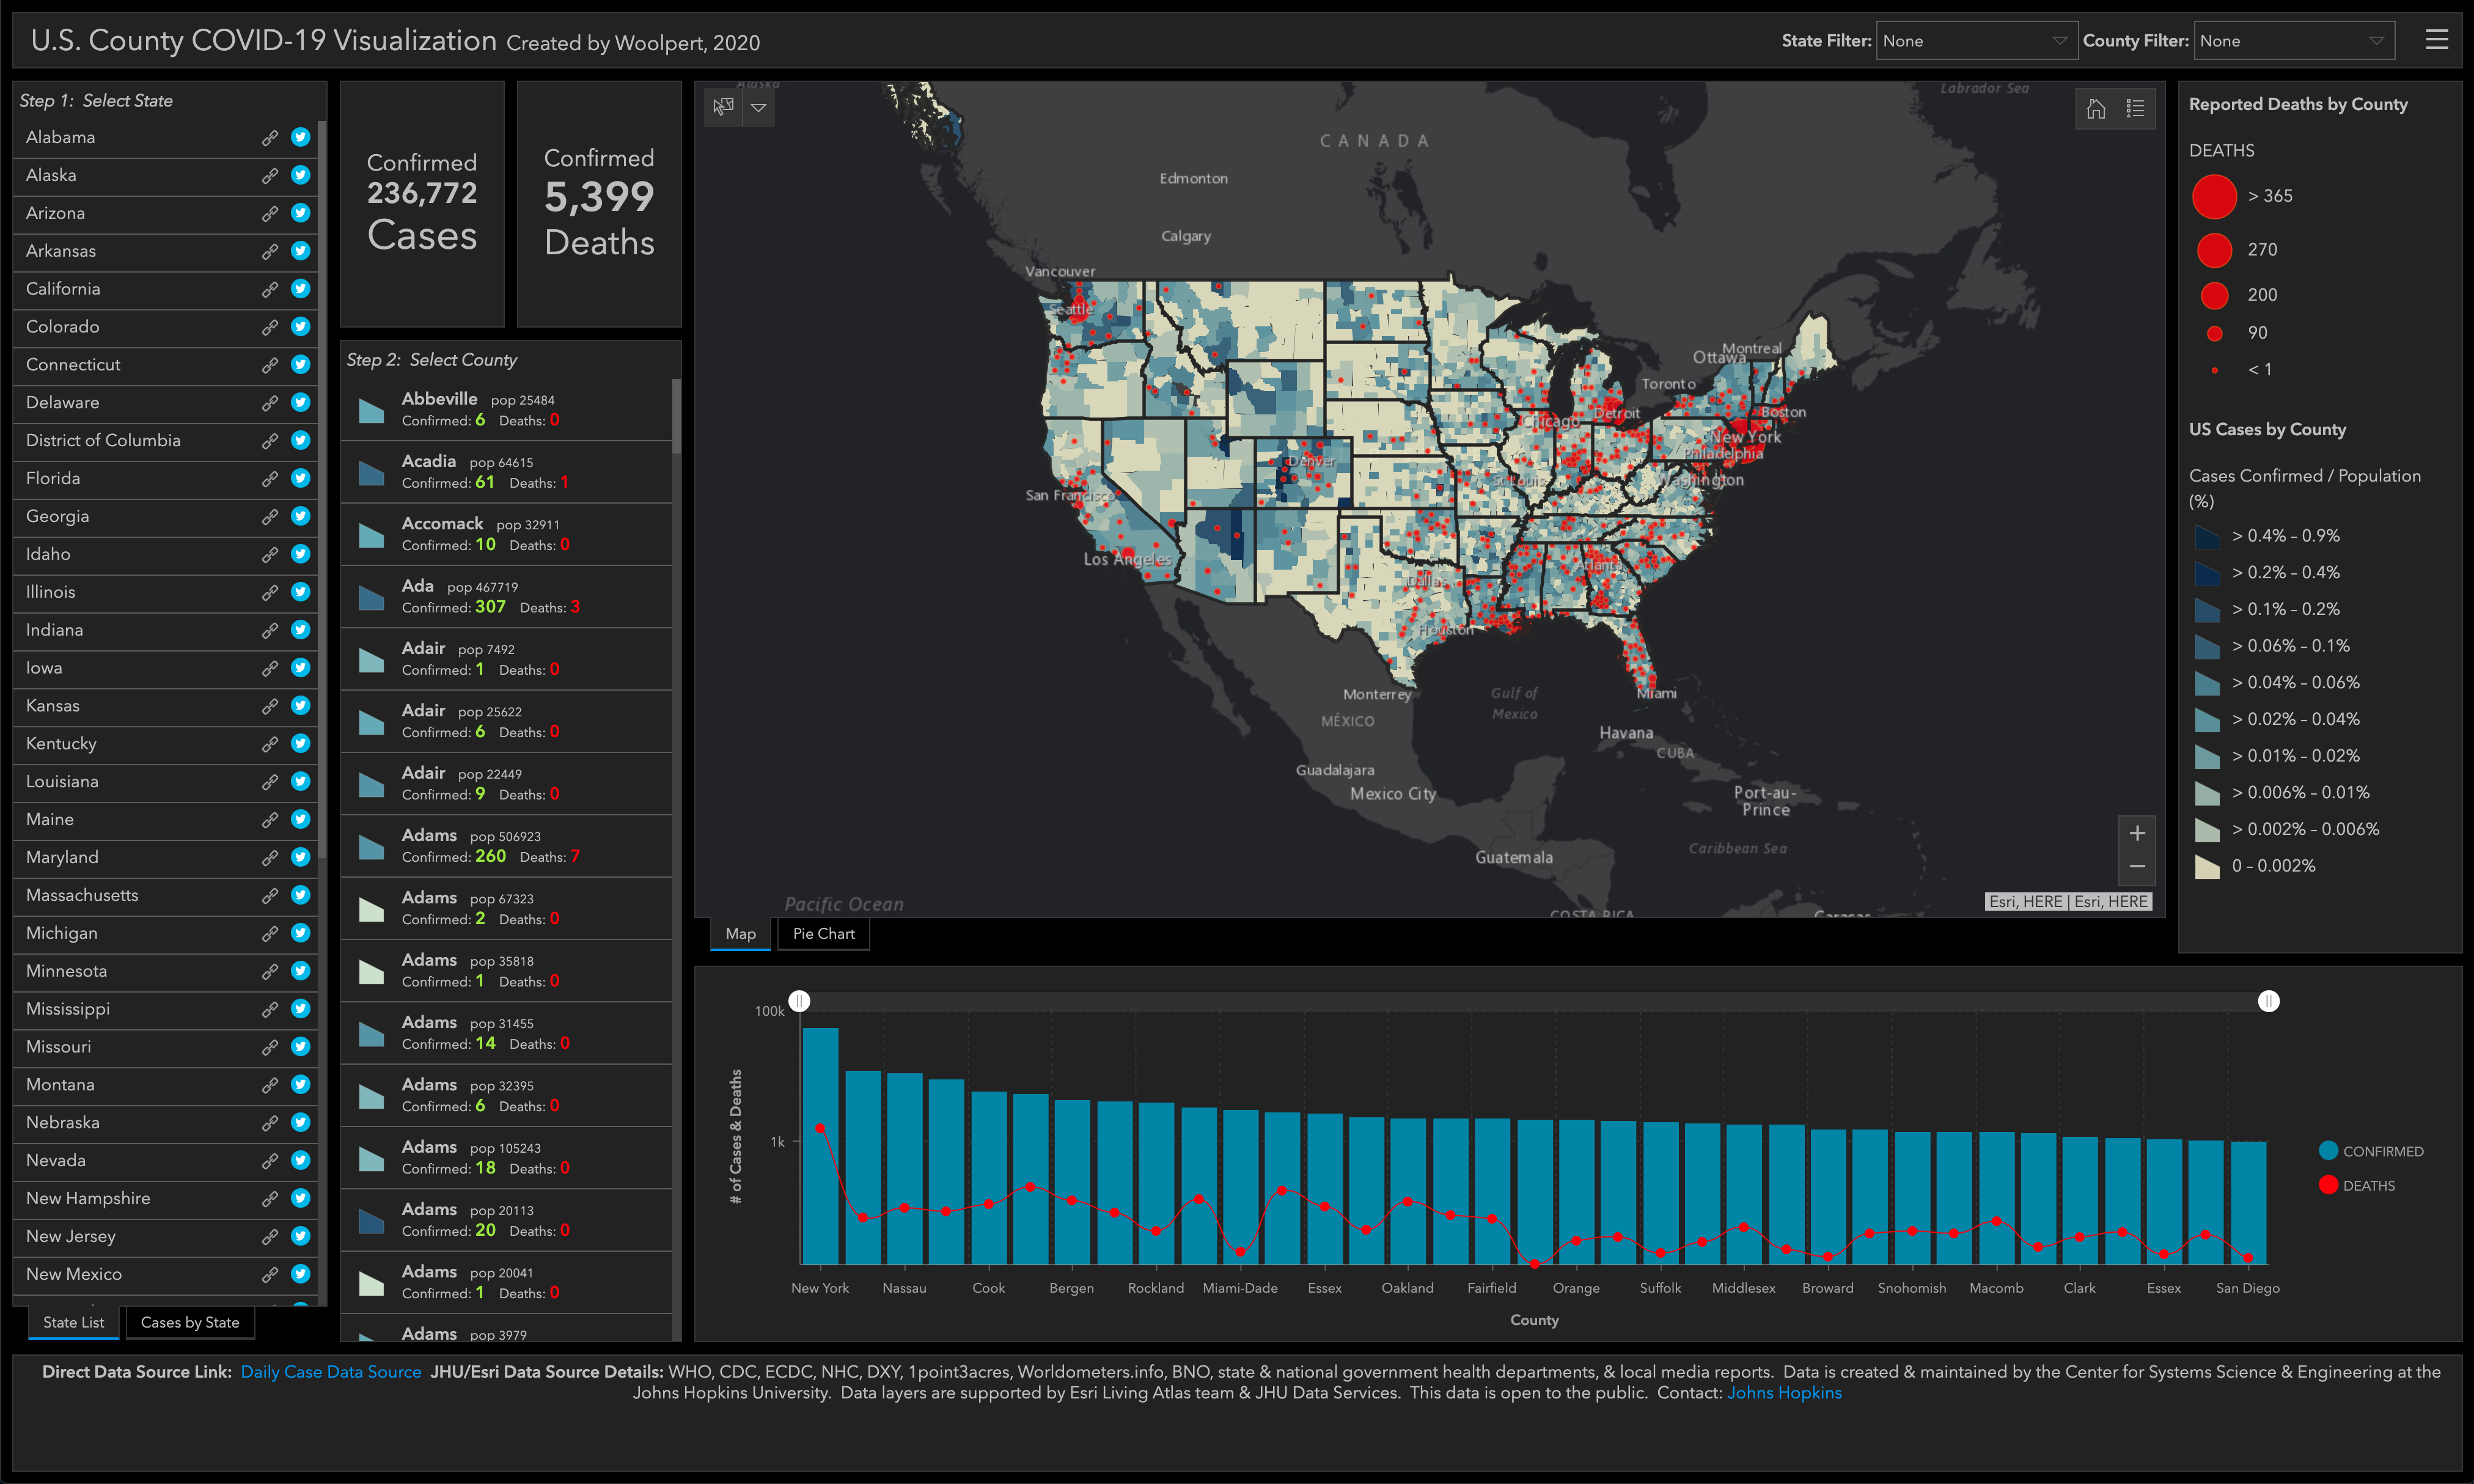
Updated Data Regarding COVID-19
This U.S. County COVID-19 Mapping Dashboard shows the county-by-county impact of the coronavirus across the U.S., including percentages of the population infected. https://covid.woolpert.com The link to the desktop version is on the left of this home page, and the mobile version on the right.
By clicking on any state in the left column, state data by county will appear. The map can also be used to navigate to an area of interest and the statistics for all counties within the map will update. There are links to each state’s data and surveillance dashboard and to the Twitter accounts of each state’s department of health.
This information will be refreshed daily as data becomes available.
For additional data, check out the COVID-19 GIS Hub by our partner Esri at https://coronavirus-disasterresponse.hub.arcgis.com/ #covid19
Disaster Relief Information for Dayton, Ohio
To help those affected by the tornadoes that hit near our headquarters in Dayton, Ohio, on May 27, here is a map that shows key disaster resource centers, shelters and related contact information.
This imagery, best viewed on Chrome, can be viewed by clicking on the Layer List icon in the top right corner, and then on the "Woolpert SmartView Connect Imagery" box in the list below.
For a slider view of this imagery and map, click on the Swipe button under the search field on the top left. You can then grab the bar with your mouse and slide it left or right.
Preliminary tornado paths, as identified by the National Weather Service (NWS), are identified in yellow. We plan to layer additional information into this map from NOAA and/or the NWS as it becomes available.
For live Twitter updates on the event, visit https://bit.ly/2HGGy8E. Also, If any Dayton-area building owners are in need of a structural assessment in the wake of the tornadoes, please contact Frank Monastra at 937.694.8120.
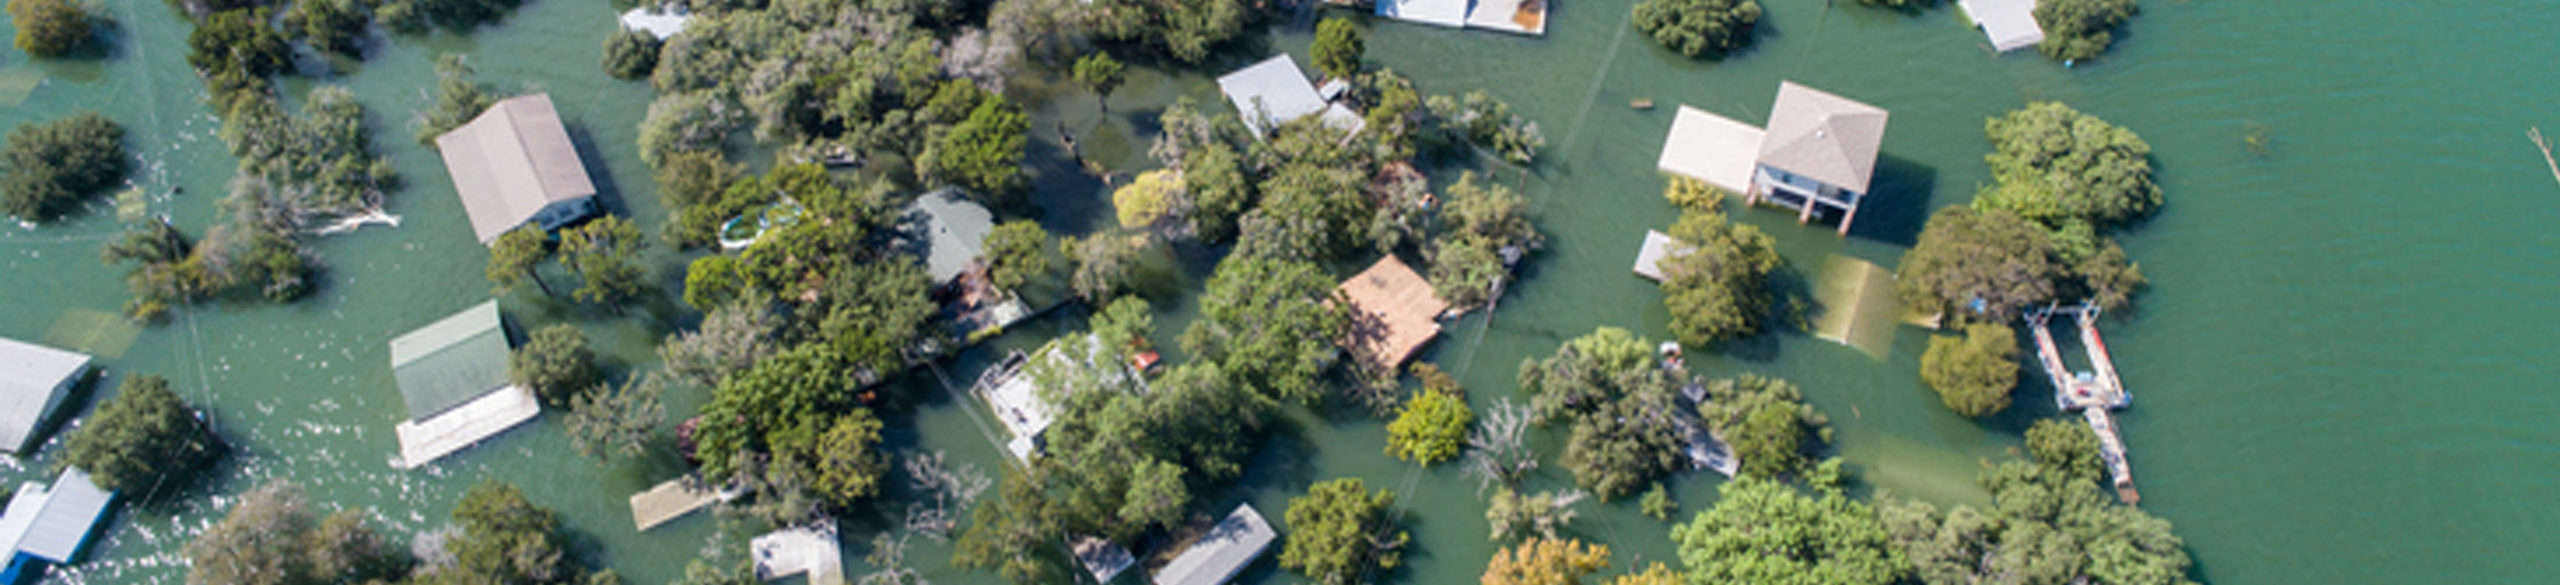
Imagery Illustrates Hurricane Irma Flooding & Damage
We were contracted by both the Florida Department of Transportation (FDOT) and Miami-Dade County to collect and deliver high-resolution, before-and-after imagery of areas in Florida affected by Hurricane Irma, immediately following the disaster. We are posting this imagery publicly to support anyone affected by the hurricane, and all disaster relief efforts. This data has been aggregated with data from the National Oceanic and Atmospheric Administration (NOAA) and Google to provide the most comprehensive view.
The imagery addresses technically separate goals. The FDOT project documents the flooding caused by the hurricane. It includes 1,000 square miles of imagery along the St. Johns River that was captured as the water was cresting. This collection includes sites across four counties—St. Johns, Duval, Putnam and Clay—from Palatka to Jacksonville. The Miami-Dade collection covers the county to help assess comprehensive post-storm damage.
For more information about this collection, please see our recent Hurricane Irma press release.
For more information on our aerial imagery services, contact Joe Seppi at joe.seppi@woolpert.com.
Immediate Imagery from Houston Area in Wake of Hurricane Harvey
To help the millions affected by Hurricane Harvey and subsequent flooding in the state of Texas, Woolpert has collected, processed and delivered high-resolution, before-and-after aerial imagery. These maps—aggregated with data from the National Oceanic and Atmospheric Administration (NOAA) and Google to provide the most comprehensive product—allow viewers to navigate and zoom in on sites throughout the city of Houston. Viewers can identify specific areas most in need of resources and check on neighborhoods, property damage, road closures, etc. This 1-foot imagery collection began Friday, Sept. 1, after the high-water mark had been reached, and was initially posted Sunday, Sept. 3. Crews then flew again later that week, as weather allowed, to collect more imagery, get it processed and complete the city map. The data from that collection is presented here alongside imagery collected in 2016 to show precisely where and how the flooding has impacted the area.
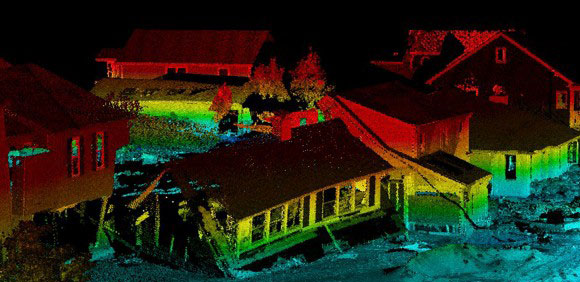
Immediate Mapping Aids Disaster Relief Efforts in South Carolina
In this behind-the-scenes video, Woolpert documents the groundbreaking disaster relief efforts taken immediately following the “thousand-year” rain event in South Carolina in October 2015. The flooding was the result of five days of steady rainfall, measuring more than 20 inches in some areas, which caused 36 dams to fail, killed 19 people and displaced another 20,000. To assist those affected by the disaster, Woolpert collected perishable orthoimagery as soon as the skies cleared, processed that data, and shared created maps accessible via website and app within 36 hours. The speed with which Woolpert was able to pull this off translated to “real-time” help on the ground during the critical hours and days following this event. The video also provides lessons learned from this endeavor, and how states can better prepare for natural disasters.
Emergency Response Experience: Hurricane Sandy
Contact

Services
- Airborne data collection
- Field data collection and surveying
- Mobile mapping system
- Unmanned aircraft system
- Secure data solutions
Contracting Vehicles
Woolpert’s contracting vehicles provide federal agencies with access to Woolpert’s multidisciplinary services. We can draw on experts across the firm to make our emergency response solutions available quickly.
Current Woolpert contracting vehicles include:
- USGS GPSC II
- NOAA CSC