BLOG
A “Smart” Approach to Energy Savings
Written by Qassim Abdullah and Nadja Turek
Let’s admit it—the average energy efficiency toolkit is a bit tired, ripe for innovation and “smart” technology.
As they have for decades, utilities’ energy efficiency programs typically rely on rebates to catalyze action. Think of rebates as “carrots” for homeowners and businesses to weatherize or upgrade/replace equipment. The hope is that these rebate carrots will remove the cost barrier between standard and more efficient (and presumably more expensive) equipment. However, rebates are not a systematic “worst first” approach to finding and fixing energy hogs in the community.
Another widely used tool is the energy audit, which requires on-site data collection and inspection by a qualified auditor. Because audits are conducted manually, one building at a time, the process is slow and expensive; however, the results are thorough and tailored.
In a world teeming with smart technology, is there a better way to rapidly uncover and assess the energy hogs in a utility service area, neighborhood or a campus? But of course!
What if I told you that I could fly an airplane over targeted areas and “see” energy hogs in vivid color? Neat trick, right? But that’s not all. If you then give me access to building data (thank you, IoT!), I can combine it with my fly-over to give you an actionable audit, too.
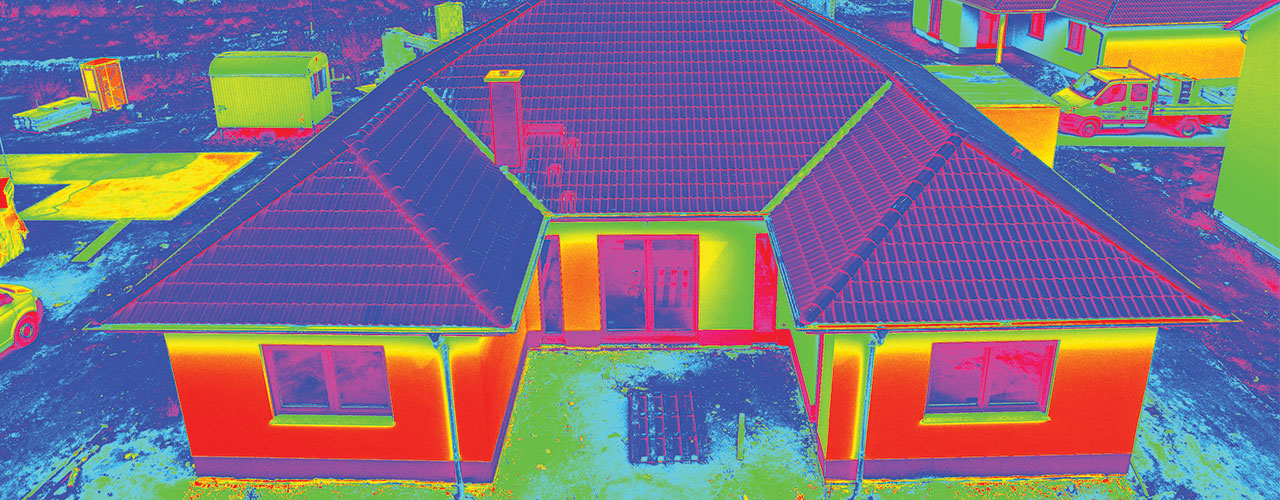
Heat Mapping
Woolpert Labs (our research and development arm) built upon work initiated by the University of Dayton’s (UD) Department of Mechanical, Aerospace, & Renewable & Clean Energy Engineering. UD students conducted field energy audits of on-campus student housing (detached homes only) by assessing housing materials and using utility bills to calculate building heat efficiencies. Woolpert’s effort began with low-altitude flights over the UD campus (during the winter) to capture building thermal imagery with a science-grade thermal sensor. The team then put the imagery through radiometric correction and photogrammetric processing to create a seamless, georeferenced mosaic for the UD campus.
As a stand-alone measure, thermal imagery is great for visualizing heat loss. However, it is plagued by a sobering number of variables, such as weather conditions and the varying emissivity of materials. For a broader application, thermal imagery requires more specific controls. UD’s materials audits and utility usage data provided the necessary ground truthing to accurately model and quantify the heat loss identified in the imagery. Further, by studying the combined data, the team clarified the strengths and limitations of the imagery, ultimately demonstrating how and why aerial surveying via thermal imagery makes more sense for large areas, such as campuses, than traditional energy audits.
Our next step was to make the information easily accessible and actionable. Modeled after the University of Calgary’s website, MyHEAT, Woolpert calculated comparative heat scores for all the buildings imaged and hosted the UD thermal and heat score maps on its custom-designed web portal, SmartView® Connect. These web maps provided side-by-side building comparisons across the campus that enabled residential and commercial building owners to connect with their energy providers and save money on their energy bills.
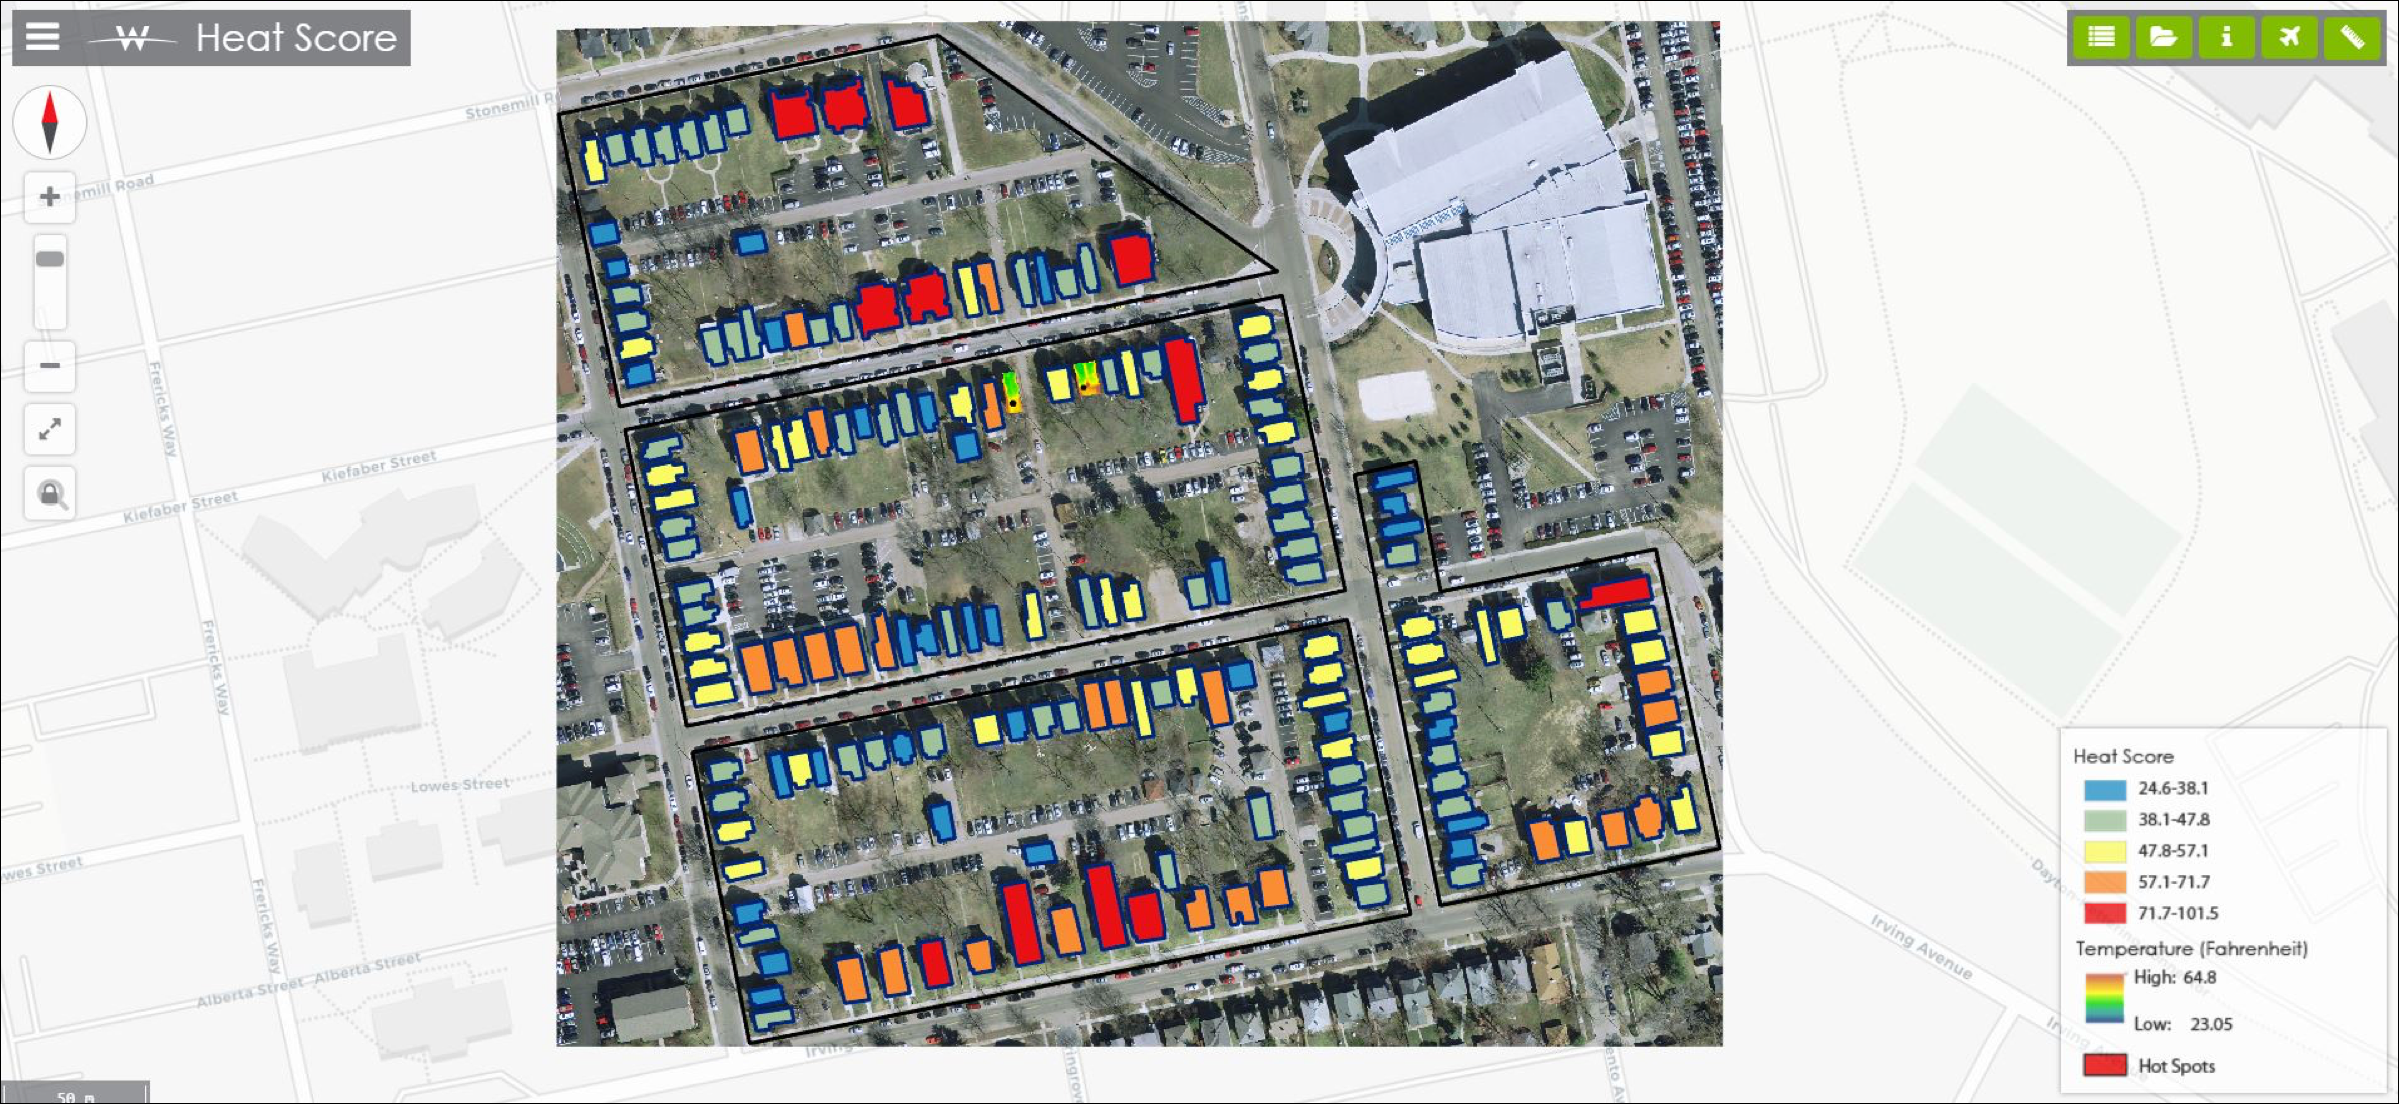
Color-coded heat score (thermal efficiency) map.
Heat Mapping + Utility and Property Data = Actionable Energy Audit
he heat score map is a helpful treasure map for targeting energy savings funds and prompting citizen action, but it is well shy of an energy audit because it provides only exterior heat loss data. However, at the scale of a community, airport, college/corporate campus or military base, it is still more cost-effective than a traditional energy audit. With an average cost of $0.10 to $0.15 per square foot, an ASHRAE Level 2 audit would cost hundreds of thousands of dollars and take several years to accomplish—before any problem areas are even addressed.
In a novel approach to energy auditing, we combined utility bill analysis with building envelope characterizations from thermal imagery. This approach demonstrates a refined energy audit with limited on-the-ground resources that can be completed over a large area and within a reduced timeframe. We’ve challenged ourselves to accurately identify as many energy efficiency measures as possible via this remote auditing technique, and we’ve eliminated much of the need to visit the target buildings.
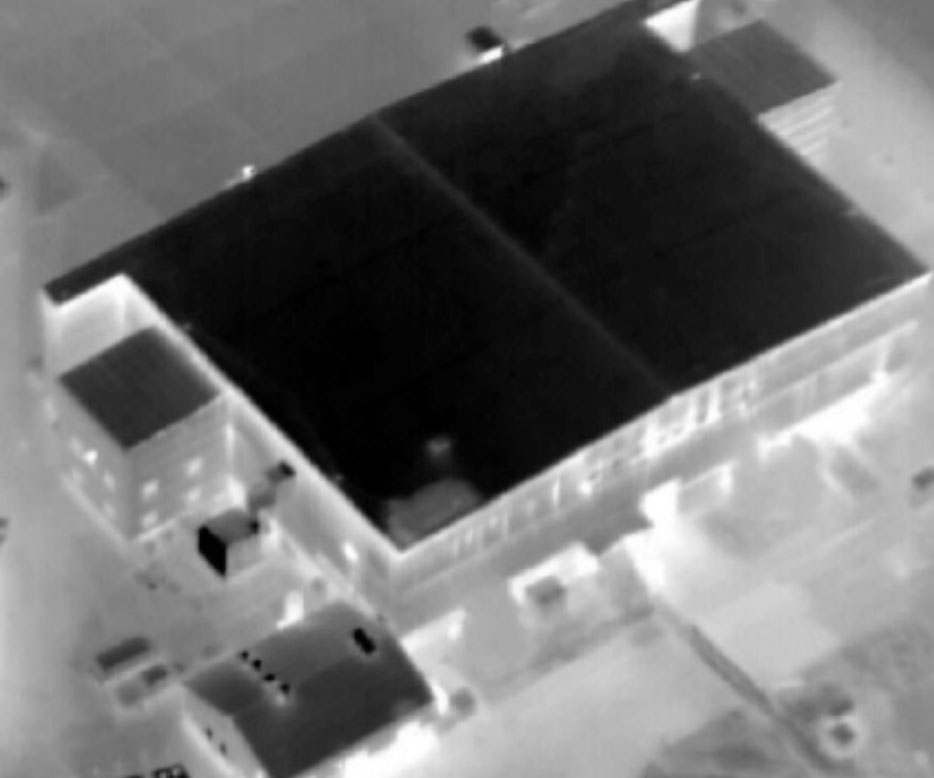
We performed a remote audit of this building for a client using utility, material and occupancy data combined with thermal imagery.
Now, what can we actually “see” by combining building data with thermal imagery? Quite a lot!
- Building envelope (wall, window, door, roof and floor) characteristics
- Building scheduling issues
- Heating and cooling system inefficiencies
- Ineffective economizer use
- Simultaneous heating/cooling efforts
The Innovation and Evolution Continue
In the near future, more real-time data from smart meters and smart buildings will be available, making remote auditing even more accurate and timely. As-needed thermal fly-overs and periodic or ongoing thermal monitoring via drones or static, mounted cameras also will provide more and better data.
Through our efforts, we hope to drive down the required time and cost of energy auditing so that energy conservation measures can be discovered and implemented sooner. This will ultimately drive down the cost of building ownership (making clients happy) and reduce greenhouse gas emissions (making everyone happy).
It’s a win-win!

Qassim A. Abdullah, Ph.D., PLS, CP
As Woolpert’s Chief Scientist, Qassim has more than 40 years of combined industrial, R&D and academic experience in analytical photogrammetry, digital remote sensing, and civil and surveying engineering. When he’s not presenting at geospatial conferences around the world, Qassim teaches photogrammetry and remote sensing courses at the University of Maryland and Penn State, authors a monthly column for the ASPRS journal PE&RS, and mentors R&D activities within woolpert_labs.

Nadja Turek
Nadja Turek, a civil engineer and sustainable design expert, serves as Woolpert’s Research and Development Facilitator. As a former faculty member at the University of Dayton and the Air Force Institute of Technology, she is a sought-after teacher and speaker. Nadja has provided sustainability training to over 1,000 designers and engineers and given numerous presentations as a sustainable design expert. She currently serves as an Advocacy Chairperson for USGBC’s Cincinnati Chapter.